> ## Documentation Index
> Fetch the complete documentation index at: https://cubed3-dependabot-js-alerts-table.mintlify.site/llms.txt
> Use this file to discover all available pages before exploring further.
# Usage Analytics
> Use built-in Usage Analytics dashboards to understand how your deployments are used — query activity, performance, user adoption, and AI usage.
The **Usage Analytics** page provides a set of pre-built dashboards that show
how your deployments are used: how many queries run and how fast they return,
how effectively the cache serves them, how actively users engage with the
platform, and how much AI activity and token consumption your account generates.
Usage Analytics is itself a Cube application: your account's usage telemetry
is modeled as a curated set of views, and the pre-built dashboards are regular
Cube dashboards on top of them. You can use the same views to
[build your own dashboards](#build-your-own-dashboards).
Available on [Premium and above plans](https://cube.dev/pricing).
Usage Analytics is only available to account administrators.
## Pre-built dashboards
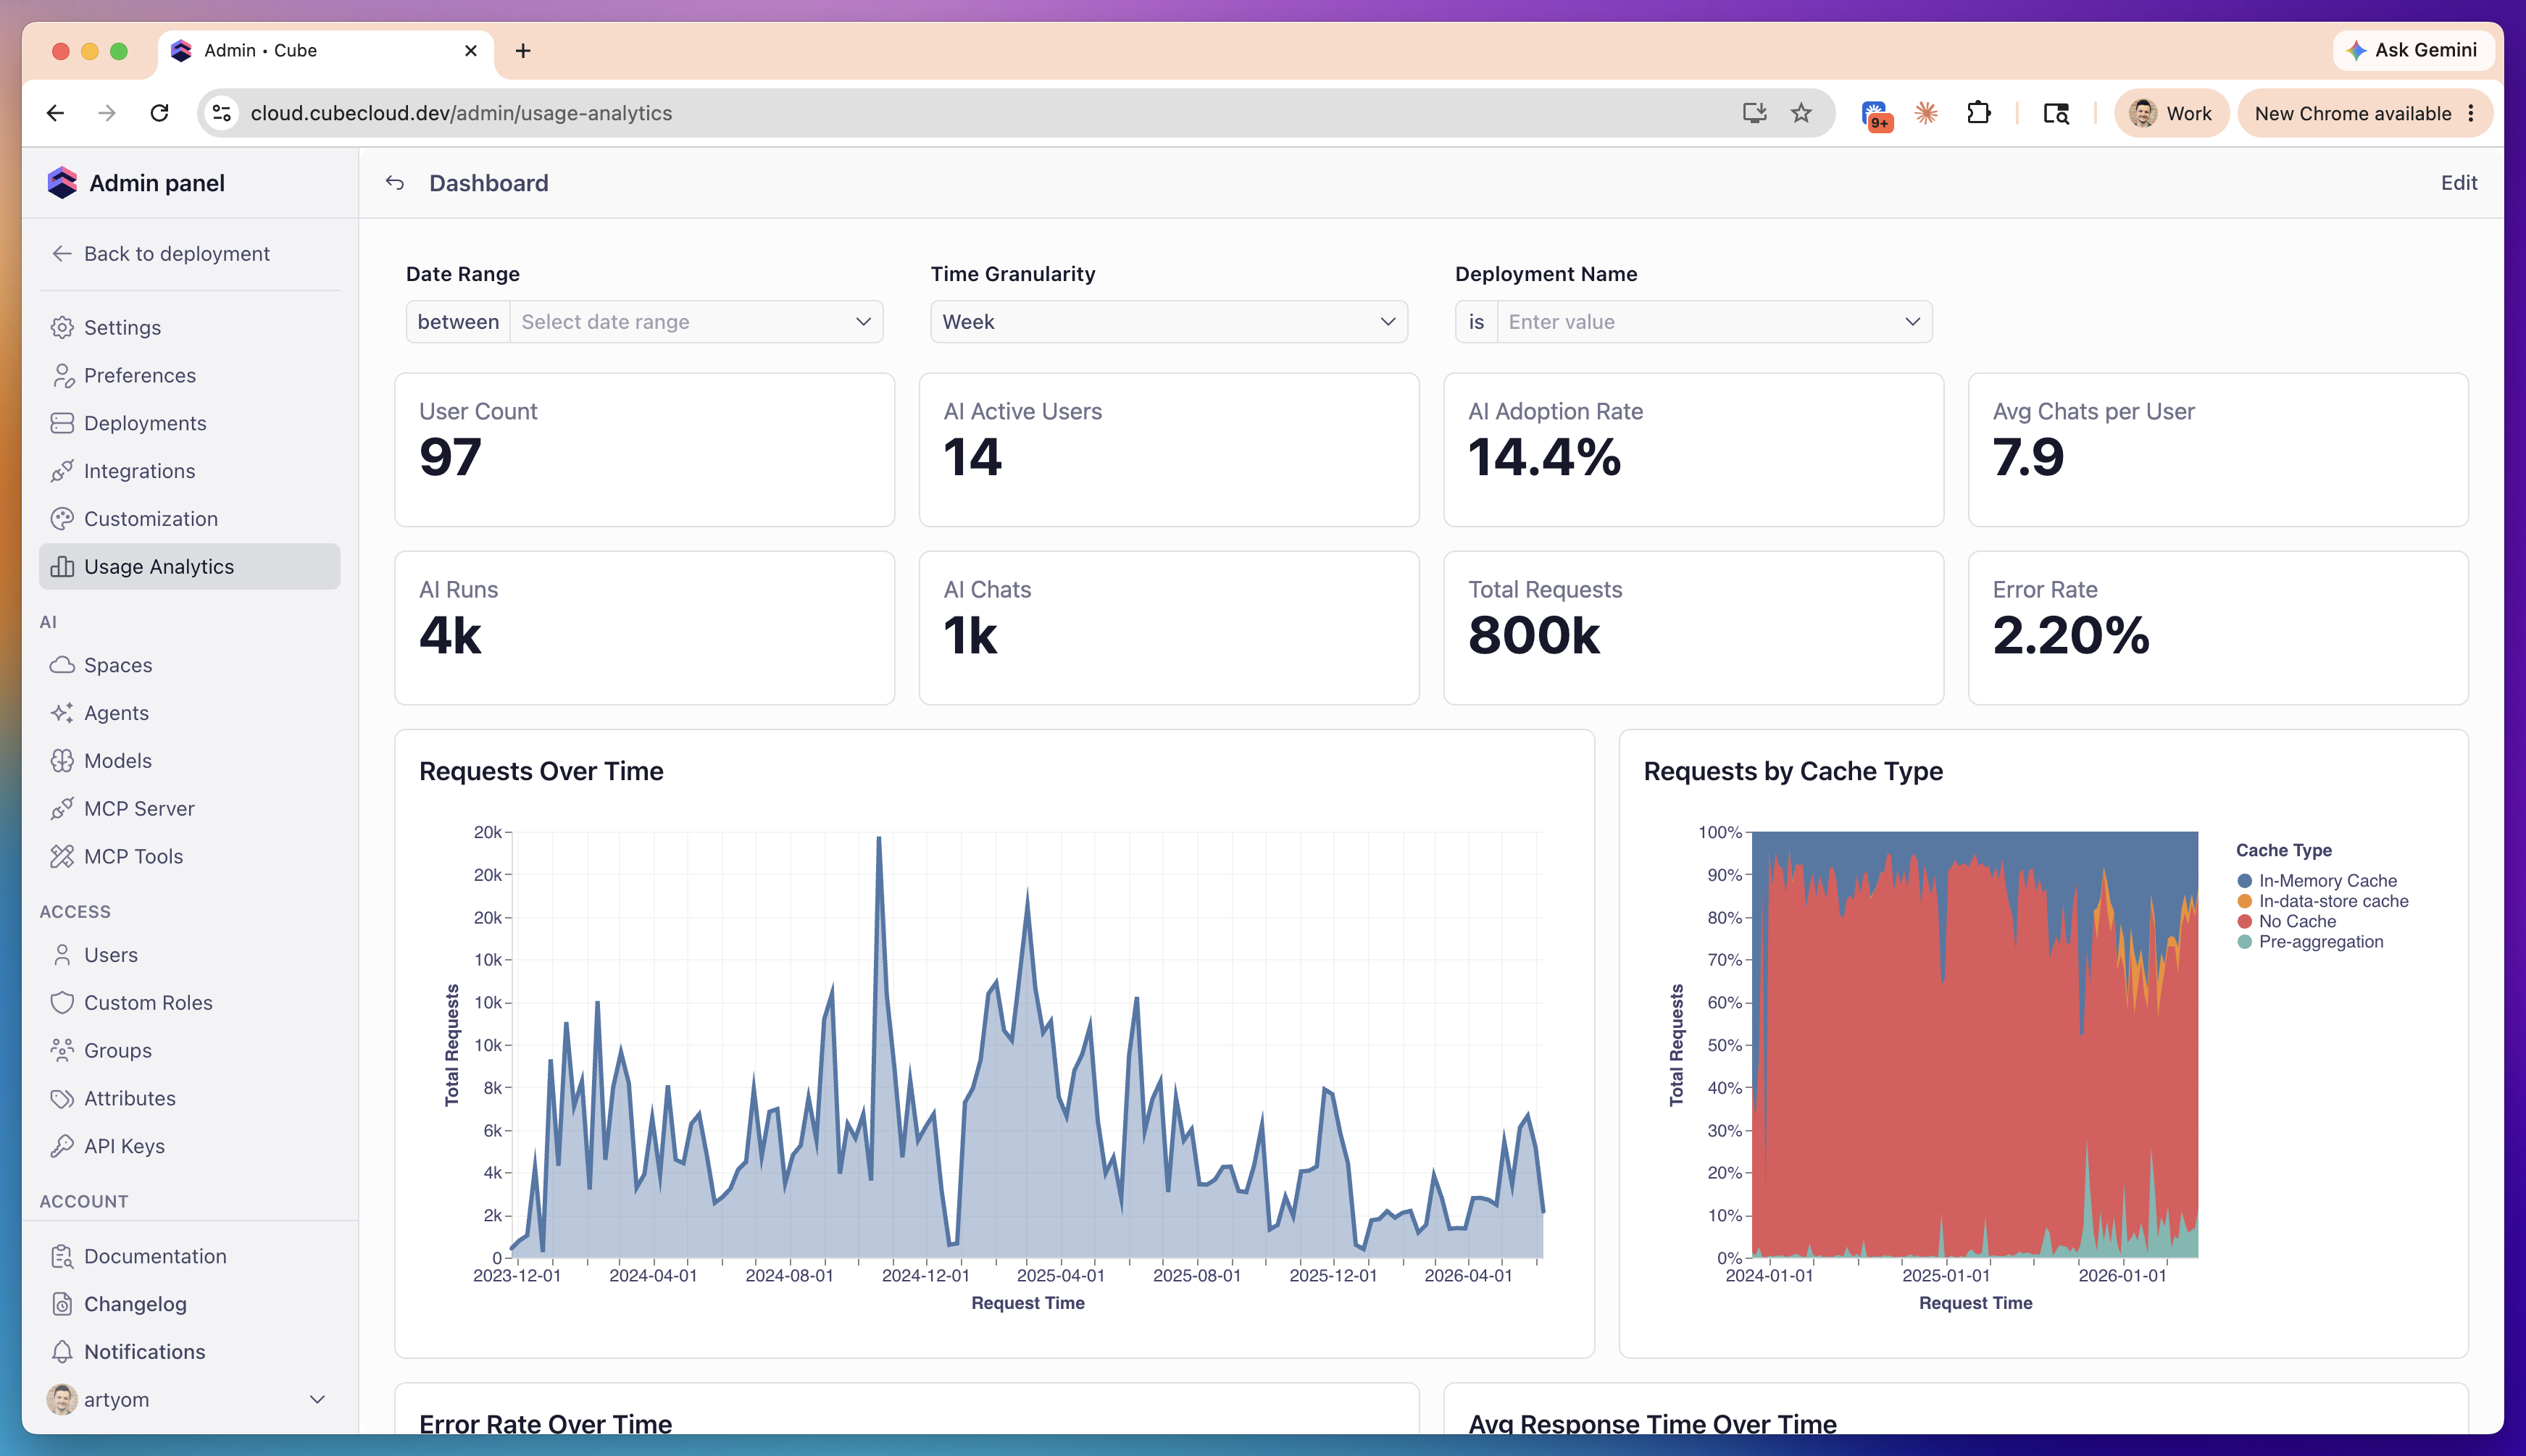
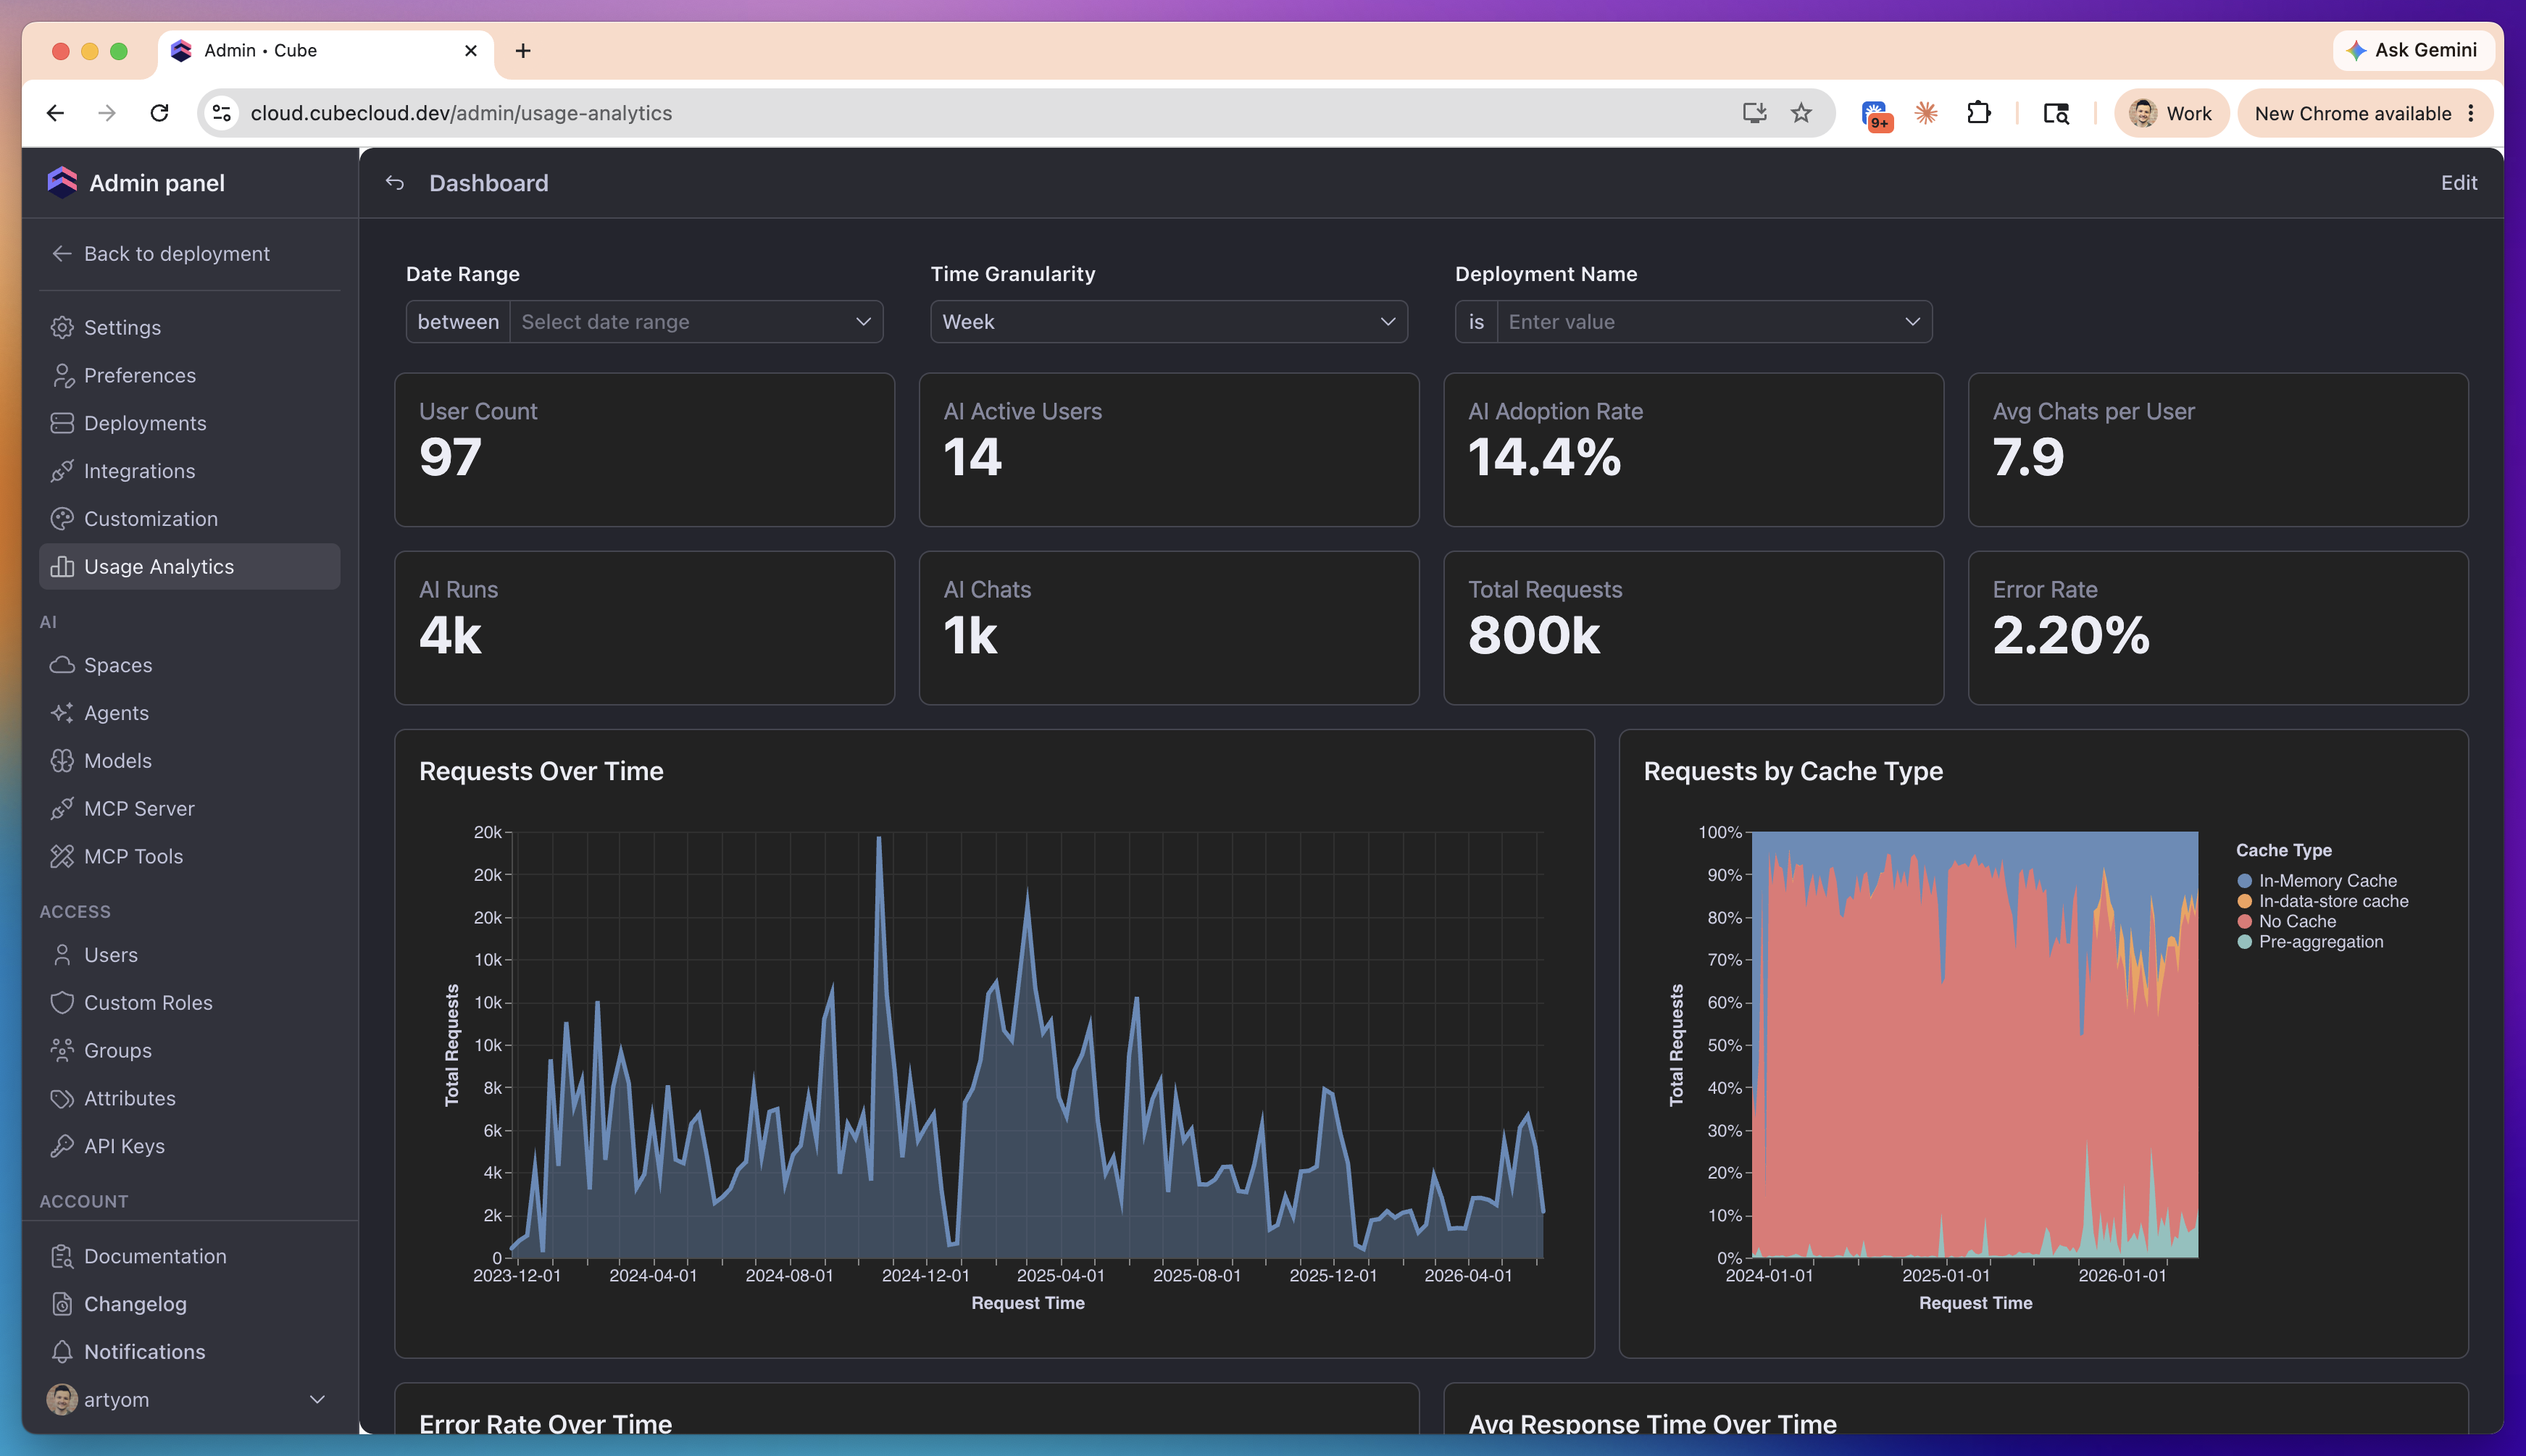
Each dashboard answers a different question about your account's usage.
 | Dashboard | Description |
| -------------------------------- | ------------------------------------------------------------------------------------------------------------------------ |
| **Overview** | High-level health and adoption at a glance: requests, error rate, cache hit rate, response time, and AI activity. |
| **Query Activity & Performance** | Query volume by API type, latency percentiles, execution-stage breakdown, slowest queries, errors, and activity heatmap. |
| **Users & Adoption** | Active users over time, new vs. returning users, engagement frequency, seat utilization, and dormant accounts. |
| **AI & Token Tracking** | AI messages and conversations by surface, AI adoption, token consumption with estimated cost, and latency. |
## Build your own dashboards
Usage Analytics runs the full Cube application in
[Creator Mode](/embedding/iframe/creator-mode), embedded inside Cube. Beyond
the pre-built dashboards, you get the complete authoring experience: explore
the usage data, create workbooks, and assemble your own dashboards from it.
Your dashboards can query every curated view below — including the five
dashboard views, which no pre-built dashboard uses. Anything you build stays
private unless you share it.
| View | What it contains |
| -------------------------- | ----------------------------------------------------------------------------------------------------------------------------------------------------------------------------------------------------------------------------------------------------------------------------------------------------------------------------------------------------------------------------------- |
| **API Requests** | Every query hitting your deployments' data APIs, with timing, caching, and errors. `tenant_id` here is your own Cube account, not an embed tenant — row-level security pins every query to it, so this view can't be used to compare your embed tenants against each other. For per-request detail on one deployment, see [Query History](/admin/monitoring/query-history) instead. |
| **AI Usage** | AI messages grouped into conversations and sessions, with context, token consumption, estimated cost, and latency. |
| **Users & Adoption** | Users and their engagement: sign-ups, active users, activity frequency, seat utilization, and dormant accounts. |
| **Dashboard Usage** | Every dashboard in your account — opens, viewers, surface, and when it was last touched — including ones nobody has opened yet. |
| **Dashboard Engagement** | One row per view session: dwell time and whether the viewer did anything at all. |
| **Dashboard Interactions** | In-dashboard actions: filter changes, refreshes, exports, drill-ins, chat opens. |
| **Dashboard Authoring** | Publishes and deletions — who ships dashboard changes and who removes them. |
| **Dashboard Inventory** | A daily snapshot of the dashboard estate, for trends over time. |
If you embed Cube for multiple customers, Dashboard Usage carries
`viewer_embed_tenant` — which of your embed customers' users did the looking.
Dashboard Usage, Authoring, and Inventory all carry `embed_tenant_name` — which
embed tenant the content itself belongs to. The two can disagree, since a viewer
from one customer can open a dashboard that lives in another partition. Dashboard
Engagement and Dashboard Interactions are collected client-side and are suppressed entirely
for embedded Creator Mode, so they carry no embed-tenant breakdown and return
nothing for embed-only traffic — that's suppression, not zero usage.
## Query programmatically
Beyond the embedded dashboards, account administrators can mint a short-lived
Cube API token to query the same usage and billing data directly — from the
[REST API](/reference/core-data-apis/rest-api), a BI
tool, or a script — instead of only viewing it in-app.
```bash theme={"dark"}
curl -X POST https://your-account.cubecloud.dev/api/v1/usage-analytics/token \
-H "Authorization: Bearer "
```
The response includes a `token`, the `apiUrl` to send it to, and an
`expiresAt` timestamp:
```json theme={"dark"}
{
"token": "eyJhbGc...",
"apiUrl": "https://usage-analytics.cubecloud.dev/cubejs-api/v1",
"deploymentId": 331,
"expiresAt": "2026-09-03T13:00:00.000Z"
}
```
The token is scoped to your account, the same way the embedded page is, so
queries only ever see your own data. It expires after **1 hour** — issue a
fresh one for each session or scheduled refresh rather than caching it.
Requires an API key belonging to an account administrator, and Usage
Analytics enabled for the account.
## Data freshness and isolation
Usage Analytics data is available on a slight delay compared to live activity.
For real-time inspection of individual queries, use
[Query History](/admin/monitoring/query-history).
Usage Analytics content is isolated from your own deployments' content: the
views and dashboards described above don't appear in your data model, and your
end users can't access them.
| Dashboard | Description |
| -------------------------------- | ------------------------------------------------------------------------------------------------------------------------ |
| **Overview** | High-level health and adoption at a glance: requests, error rate, cache hit rate, response time, and AI activity. |
| **Query Activity & Performance** | Query volume by API type, latency percentiles, execution-stage breakdown, slowest queries, errors, and activity heatmap. |
| **Users & Adoption** | Active users over time, new vs. returning users, engagement frequency, seat utilization, and dormant accounts. |
| **AI & Token Tracking** | AI messages and conversations by surface, AI adoption, token consumption with estimated cost, and latency. |
## Build your own dashboards
Usage Analytics runs the full Cube application in
[Creator Mode](/embedding/iframe/creator-mode), embedded inside Cube. Beyond
the pre-built dashboards, you get the complete authoring experience: explore
the usage data, create workbooks, and assemble your own dashboards from it.
Your dashboards can query every curated view below — including the five
dashboard views, which no pre-built dashboard uses. Anything you build stays
private unless you share it.
| View | What it contains |
| -------------------------- | ----------------------------------------------------------------------------------------------------------------------------------------------------------------------------------------------------------------------------------------------------------------------------------------------------------------------------------------------------------------------------------- |
| **API Requests** | Every query hitting your deployments' data APIs, with timing, caching, and errors. `tenant_id` here is your own Cube account, not an embed tenant — row-level security pins every query to it, so this view can't be used to compare your embed tenants against each other. For per-request detail on one deployment, see [Query History](/admin/monitoring/query-history) instead. |
| **AI Usage** | AI messages grouped into conversations and sessions, with context, token consumption, estimated cost, and latency. |
| **Users & Adoption** | Users and their engagement: sign-ups, active users, activity frequency, seat utilization, and dormant accounts. |
| **Dashboard Usage** | Every dashboard in your account — opens, viewers, surface, and when it was last touched — including ones nobody has opened yet. |
| **Dashboard Engagement** | One row per view session: dwell time and whether the viewer did anything at all. |
| **Dashboard Interactions** | In-dashboard actions: filter changes, refreshes, exports, drill-ins, chat opens. |
| **Dashboard Authoring** | Publishes and deletions — who ships dashboard changes and who removes them. |
| **Dashboard Inventory** | A daily snapshot of the dashboard estate, for trends over time. |
If you embed Cube for multiple customers, Dashboard Usage carries
`viewer_embed_tenant` — which of your embed customers' users did the looking.
Dashboard Usage, Authoring, and Inventory all carry `embed_tenant_name` — which
embed tenant the content itself belongs to. The two can disagree, since a viewer
from one customer can open a dashboard that lives in another partition. Dashboard
Engagement and Dashboard Interactions are collected client-side and are suppressed entirely
for embedded Creator Mode, so they carry no embed-tenant breakdown and return
nothing for embed-only traffic — that's suppression, not zero usage.
## Query programmatically
Beyond the embedded dashboards, account administrators can mint a short-lived
Cube API token to query the same usage and billing data directly — from the
[REST API](/reference/core-data-apis/rest-api), a BI
tool, or a script — instead of only viewing it in-app.
```bash theme={"dark"}
curl -X POST https://your-account.cubecloud.dev/api/v1/usage-analytics/token \
-H "Authorization: Bearer "
```
The response includes a `token`, the `apiUrl` to send it to, and an
`expiresAt` timestamp:
```json theme={"dark"}
{
"token": "eyJhbGc...",
"apiUrl": "https://usage-analytics.cubecloud.dev/cubejs-api/v1",
"deploymentId": 331,
"expiresAt": "2026-09-03T13:00:00.000Z"
}
```
The token is scoped to your account, the same way the embedded page is, so
queries only ever see your own data. It expires after **1 hour** — issue a
fresh one for each session or scheduled refresh rather than caching it.
Requires an API key belonging to an account administrator, and Usage
Analytics enabled for the account.
## Data freshness and isolation
Usage Analytics data is available on a slight delay compared to live activity.
For real-time inspection of individual queries, use
[Query History](/admin/monitoring/query-history).
Usage Analytics content is isolated from your own deployments' content: the
views and dashboards described above don't appear in your data model, and your
end users can't access them.